Solution

Visualization system
- #Selection
- #Implementation
- #People, Culture, Organization, IT
Background
The ICT constantly experiences radical improvements and ideas using ICT to improve the efficiency and productivity of work are being created everywhere.
Even in the process of information integration, visualization, and analysis, it has changed significantly from the past when dedicated software and expertise were required. It is becoming possible for anyone to easily handle large amounts of data and gain useful insights. In recent years, tools that can automate the process of information collection and analysis were launched and implementing effectively such tools enables successful higher productivity of work.
 Issues(As Is)
Ease of use does not only have a positive impact on organizational behavior. In the case of promoting where information is collected and visualization, the number of organizational layers and decision-making meetings increases, and being in disorder of various reports created on a case-by-case basis is frequently seen in the organization. When the reports being in disorder and the processed data within the organization are dispersed, it is difficult to access the latest version of the data, additionally it increases the risk of making wrong decisions. Even if centralized management of information is advanced through the implementation of a large-scale system, in the situation of the secondary data is in disorder, it cannot be called a fundamental problem-solving.
 Goal(To Be)
The followings are examples of the ideal situation to solve these issues and problems.
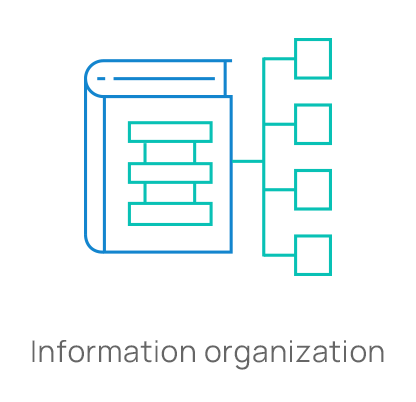
- Based on the purpose of decision-making, it can be easily created a required report for dicision-making and also organized required information for creationg them
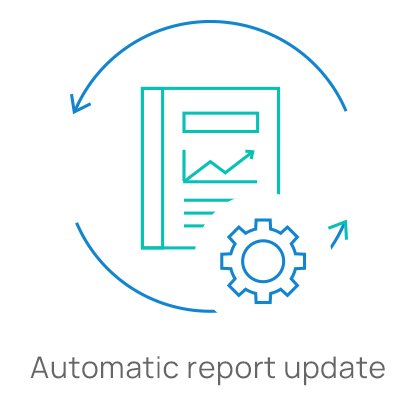
- The report is automatically updated without human intervention with the update of the source data
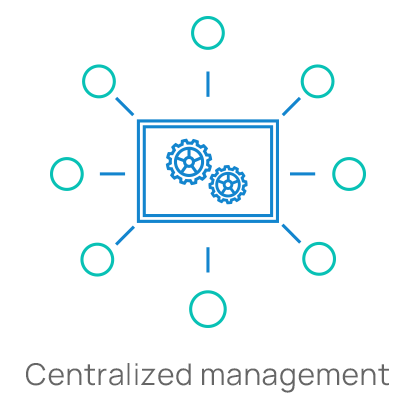
- Correct decision-making is made based on centrally managed information without the secondary data being in disorder
Solutions
Following solutions are proposed to achieve the ideal situation.
- Organize the reporting process within your organization and review and identify the requires reports the required reports
- Develop customized reports that can be automatically generated by using BI tools (QlikView, etc.)
Example of implementation report
- Marketing area: Strategic dashboard for visualization of sales status of all locations and products, market share by combining with public data, etc.
- Product development area: Portfolio dashboard, a simulation tool for resource management
- S & Op area: Visualization of inventory rate/allocation plan for each location, load balancing simulation tools between production sites
Our Values
We contribute to improving your values by providing following solutions.
- Contribute to achieving timely decision-making based on correct information
- Achieve a reduction of man-hour load in information processing and report creation
- Propose effective KPIs based on the cases of each company
Contact for solutions
If you are interested in our solutions, please contact us using the form.
Please feel free to contact us with any concerns or questions.
Other solutions
- 1Decision-making process
- 2Portfolio management
- 3Road-mapping
- 4Partnering
- 5Implementation of PM (Project Management) system
- 6Build scheme for PMO / Directly support PMO as a PMO member
- 7Building Project Systems
- 8PM (Project Management) maturity analysis
- 9PM (Project Management) training
- 10Visualization system